Golf Insight from Altitude : 10 Industries in 10 Days – What You See, What We See!
10 industries, 10 days. As we promised yesterday, we are going to provide a short overview of some of the key benefits that can come from a drone flyover – or what we call, ‘insight from altitude.’
Let’s start with the golf industry, since that is one of the major areas of focus. In the last six months, we’ve done a talk for both PGA golf professionals as well as golf course superintendents on the powerful role that a drone flyover can provide from a marketing and course management perspective.
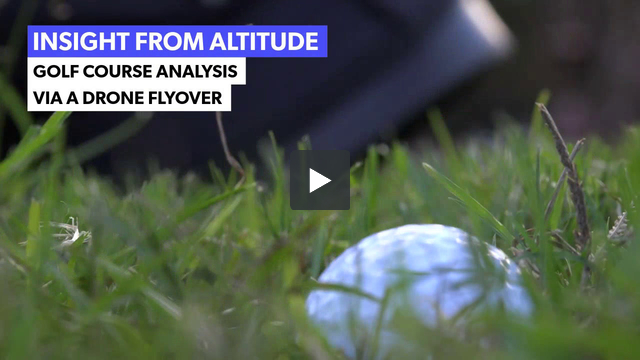
To get you into the right frame of mind, we’ve prepared for you this short video clip – to outline ‘what you see,’ and ‘what we see.’ We’ll use that format for the rest of the posts in this series.
With that format in mind:
What You See:
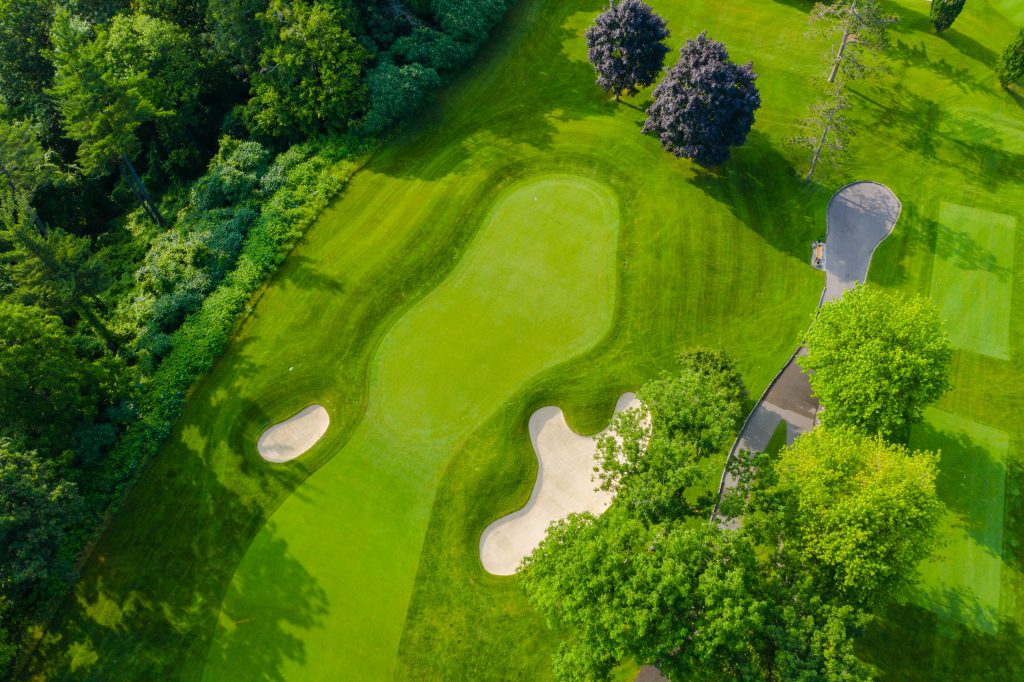
- A wonderful view of the golf course that wasn’t previously available. Once we take your mind skywards, you truly do start to view the world in a new and different way!
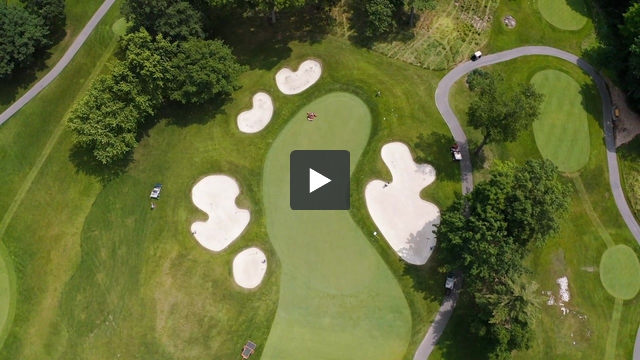
- Right off the bat, you are probably seeing significant course marketing opportunities – and that much is true. Here’s a marketing video of the particular course featured in the course above – Credit Valley Golf and Country Club, in Mississauga, Ontario, Canada
What We See:
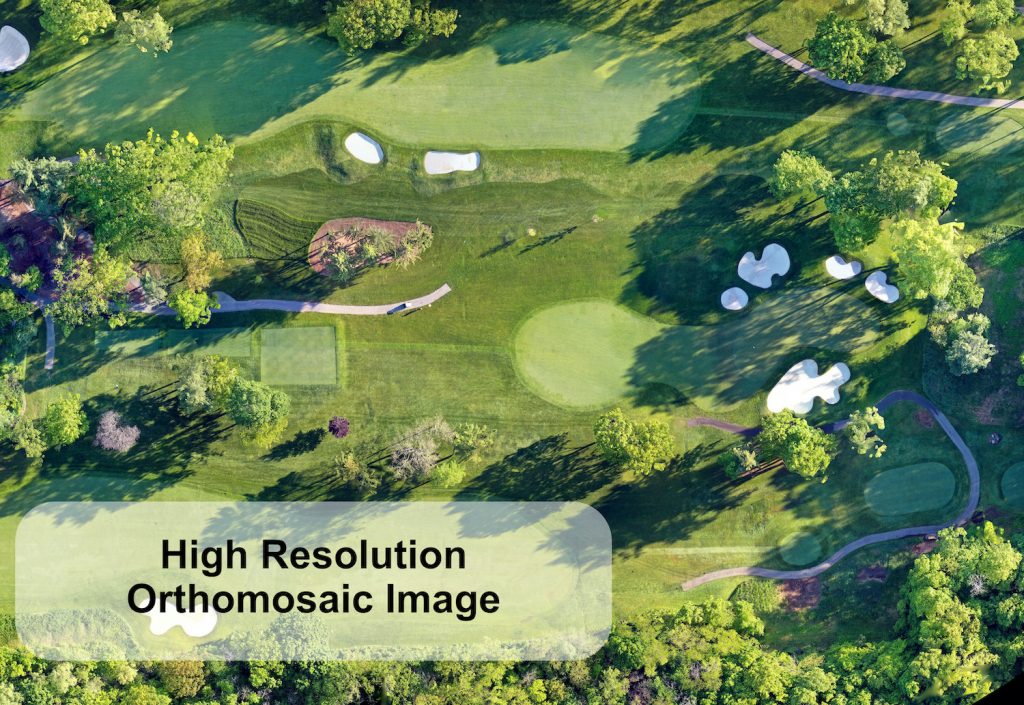
As we’ve written in previous posts, our drone flyover captures hundreds of photos and gigabytes of information.
This is all stitched into one, or several, large scale composite maps, known as an “orthomosaic.” Something like the image below! This image forms the basis for the analysis that we then undertake.
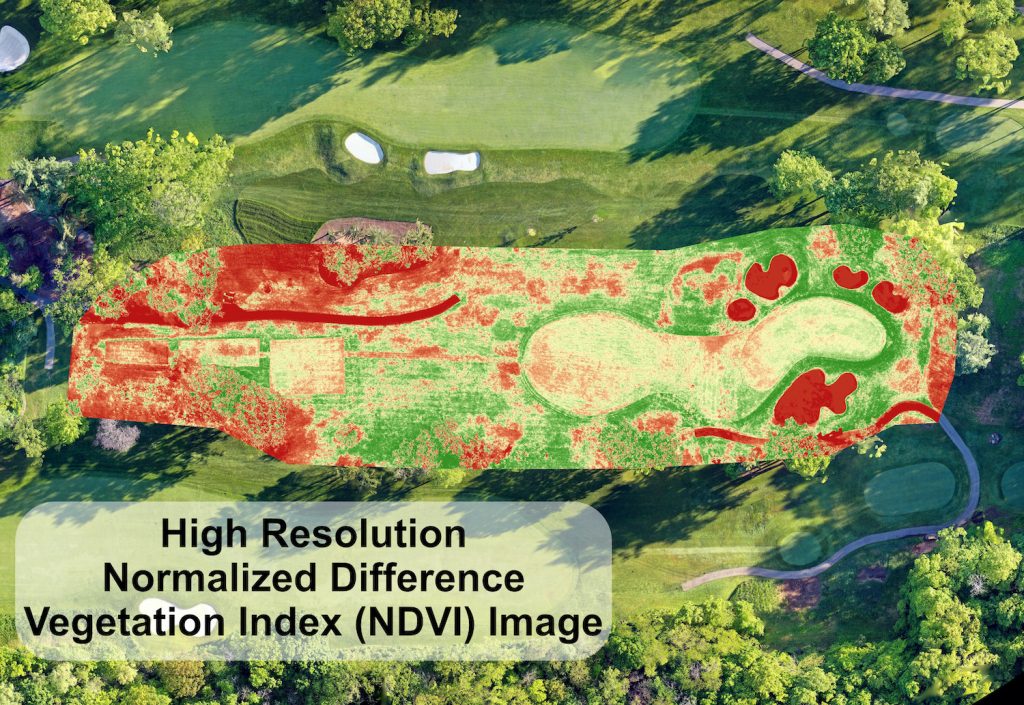
For example, we can then process the high resolution orthomosaic image with a high resolution Near Infrared image into a high resolution Normalized Different Vegetation Index (NDVI) map.
A NDVI map will show areas represented by healthy turf as positive numbers and with a green colour shading (image below). These areas that are shown as healthier areas would in turn require less maintenance than other areas identified as unhealthy or areas of concern. Areas in red or low NDVI values represent these unhealthy plants or plants that could be infected with disease or are damaged from pests (image below). As the data collected is fully GPS calibrated, the data can be uploaded to any smart device and carried into the field to allow for field checks by grounds crews. These field checks can be useful to help to determine a course of action to help improve the quality of the turf in these areas. This will allow for grounds crews to be more efficient so that they do not spend time on areas that may not need as much care. contour maps, and other means of analysis the information gained from altitude.
Here’s an example of an NDVI map – which provides valuable insight on a variety of course health issues. Areas in solid red are bunkers and cart paths.
In addition to these NDVI maps; contour maps, and other means of information analysis gained from altitude are available from the flyover with the drone.
What insight does this provide us? What do we see?
- Turf health
- Landscape and water runoff areas
- Potential areas for river or water feature erosion
- Areas of high traffic causing turf damage, indicating areas for potential cart rerouting
- Tree inventory information and canopy health
- and more!
The key thing to keep in mind is that a professional drone operator with a digital mapping and technology background has the skill, knowledge and capability to take the insight from altitude and turn it into ‘actionable information’ – the key to discovering the benefits of this remarkable new technology!

Comments are closed.